At Pi42, we know navigating the ever-shifting tides of the crypto market can be a challenge. That’s why we equip our traders with a robust toolkit, including powerful technical indicators like bollinger bands.
Developed by John Bollinger, bollinger bands explained in simple terms are a versatile tool that helps you identify potential price trends, spot overbought or oversold conditions, and anticipate volatility shifts. Here’s how they can be your secret weapon on the Pi42 trading platform. To help new traders, this section also highlights what are bollinger bands in practical scenarios.
How to Read Bollinger Bands?
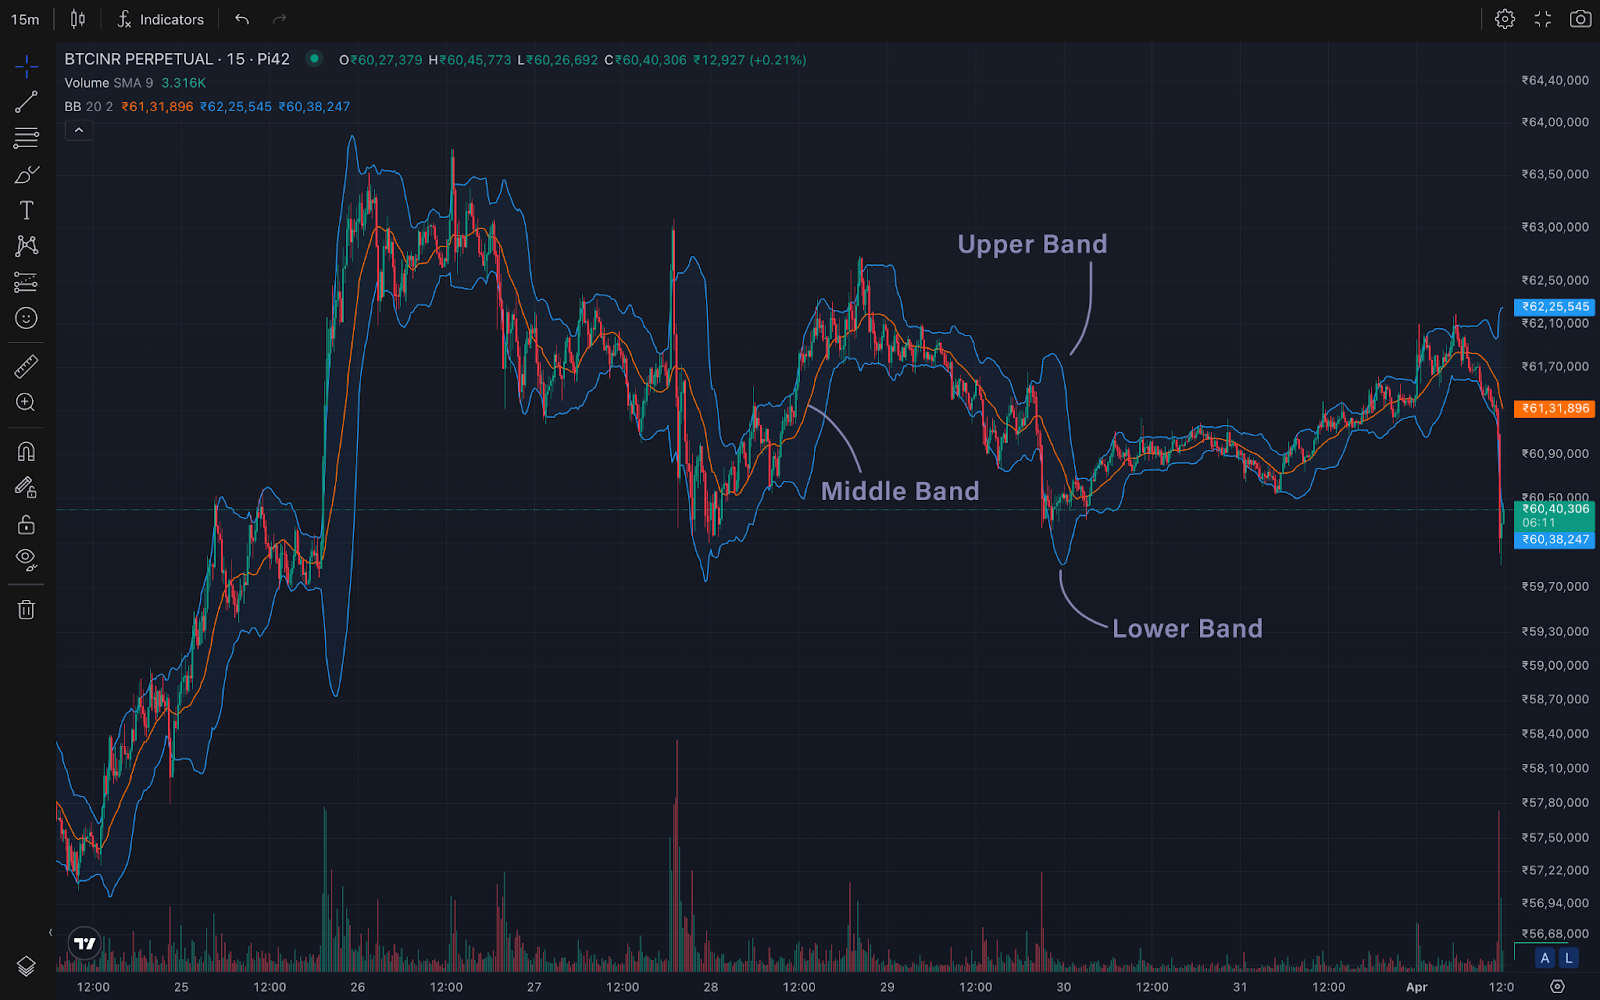
They consist of three lines:
- Middle Band: This is typically a 20-day simple moving average (SMA), representing the average price movement over the chosen timeframe.
- Upper Band: Two standard deviations above the middle band, indicating potential resistance levels.
- Lower Band: Two standard deviations below the middle band, indicating potential support levels.
The distance between the bands reflects volatility. Wider bands suggest higher volatility, while narrow bands indicate a calmer market. This forms the basis of how to read bollinger lines, especially when analysing crypto price charts.
Decoding the Bollinger Squeeze: When Calm Precedes the Storm
Pay close attention to situations where the Bollinger Bands contract significantly. This “Bollinger Squeeze” suggests a period of compressed volatility. While it might appear like a lull, it can often be a precursor to a breakout, where the price makes a sharp move in either direction.
Spotting Overbought and Oversold Conditions: Time to Rethink Your Strategy
When the price reaches the upper Bollinger Band, it signifies an overbought condition. This suggests the asset’s price might be inflated and due for a correction. Conversely, a price touching the lower band suggests an oversold condition, potentially indicating a buying opportunity.
Remember: Bollinger Bands crypto insights are helpful, but they are not crystal balls. They provide valuable insights but should be used in conjunction with other technical indicators and fundamental analysis for a comprehensive understanding of the market.
How to Use Bollinger Bands in Crypto Trading
It is important to understand the price movements within the bands:
- Volatility: The distance between the bands shows the level of volatility. When the bands widen, it signals increased volatility. When they contract, it indicates reduced volatility.
- Trend direction: If the price is above the middle band, the trend is generally considered bullish, and if it’s below, it’s considered bearish. These patterns form the foundation of how do bollinger bands work during market analysis.
Other Technical Indicators to Use with Bollinger Bands
- Relative Strength Index (RSI): Combine RSI with Bollinger Bands to spot trend reversals when the price is at an extreme level.
- Moving Averages: Using moving averages alongside Bollinger Bands can help confirm trends and price direction.
- Volume Analysis: Increased trading volume can confirm breakout signals when the price moves beyond the bands. For crypto traders, combining it with momentum indicators strengthens market predictions.
Advantages and Disadvantages of Using Bollinger Bands
| Advantages | Disadvantages |
|---|---|
| Helps identify overbought and oversold conditions. | Can produce false signals during sideways markets |
| Provides a clear view of volatility. | Whipsaw effect in volatile conditions. |
| Can be used with other indicators for confirmation. | Not always effective in trending markets. |
Trading on Pi42 with Bollinger Bands:
- Customize Your Bollinger Bands: Pi42 allows you to adjust the time frame (e.g., 50-day SMA) and standard deviation values to suit your trading strategy and the specific cryptocurrency.
- Combine Bollinger Bands with Other Indicators: Enhance your analysis by using Bollinger Bands alongside indicators like RSI or MACD to confirm potential signals and make informed trading decisions.
- Practice Makes Perfect: Test your Bollinger Band strategies using Pi42’s demo account before risking real capital.
Experienced traders often use crypto bollinger bands to refine precision during high-volatility sessions.
Master the Crypto Market with Pi42
What are bollinger lines becomes much clearer once traders experiment with real chart setups on Pi42. Bollinger bands are just one of the many powerful tools at your disposal on Pi42. With its intuitive interface, advanced charting features, and diverse asset selection, Pi42 empowers you to confidently navigate the crypto market.
Ready to take your crypto trading to the next level? Sign up on Pi42 today and explore the world of possibilities!
Frequently Asked Questions
1. Is a wider Bollinger Band bullish or bearish?
A wider Bollinger Band typically indicates higher volatility. While it doesn’t inherently signal a bullish or bearish trend, it suggests the price may experience larger swings in either direction.
2. What happens when the price breaks above the Bollinger Band?
A price breakout above the Bollinger Band can signal a potential continuation of an uptrend or a trend reversal if the price had been consolidating beforehand. However, confirming this with other indicators is important to avoid false signals.
3. Can Bollinger Bands be used on shorter timeframes?
Yes, Bollinger Bands can be applied to shorter timeframes like hourly charts. However, due to the increased volatility in shorter timeframes, you might need to adjust the number of periods used in the moving average and standard deviation calculations.
4. What are some limitations of Bollinger Bands?
Bollinger Bands primarily focus on volatility and don’t consider underlying market forces. They may not be as effective in ranging markets or during significant news events that can cause unexpected price movements.
5. How can I improve my Bollinger Band strategy?
- Combine Bollinger Bands with other technical indicators like RSI or MACD for confirmation.
- Adjust the Bollinger Band parameters (timeframe, standard deviation) based on the specific cryptocurrency and market conditions.
- Use Bollinger Bands in conjunction with fundamental analysis to gain a more holistic view of the market.