Introduction
Why 2025 still matters in 2026
From a 2026 lens, 2025 stands out as a structural watershed for crypto markets. The year wasn’t just about a bull cycle. It marked a deeper transition: crypto assets moved further into the mainstream financial system, and the derivatives market evolved from a simpler, retail-leverage-driven arena into a multi-layered ecosystem shaped by institutional capital, compliant infrastructure, and on-chain innovation.
The CoinGlass 2025 annual report frames this clearly: the early single-driver model—high leverage retail speculation—gave way to diversified institutional demand, alongside the parallel growth of regulated exchange-traded products and decentralized derivatives technology. At the same time, 2025 revealed a core contradiction of modern crypto derivatives: as markets become more sophisticated, systemic tail risk can increase due to deeper leverage chains, cross-platform capital routes, and complex hedging structures.
This blog summarises the most important findings from your provided report content and translates them into practical 2026 lessons for derivatives traders—especially those who want to think in terms of market structure, liquidity, open interest, and liquidation mechanics.
Market overview: 2025 was a high-beta liquidity trade
One of the clearest macro conclusions from 2025 was this: BTC traded more like a high-beta risk asset than an independent inflation hedge.
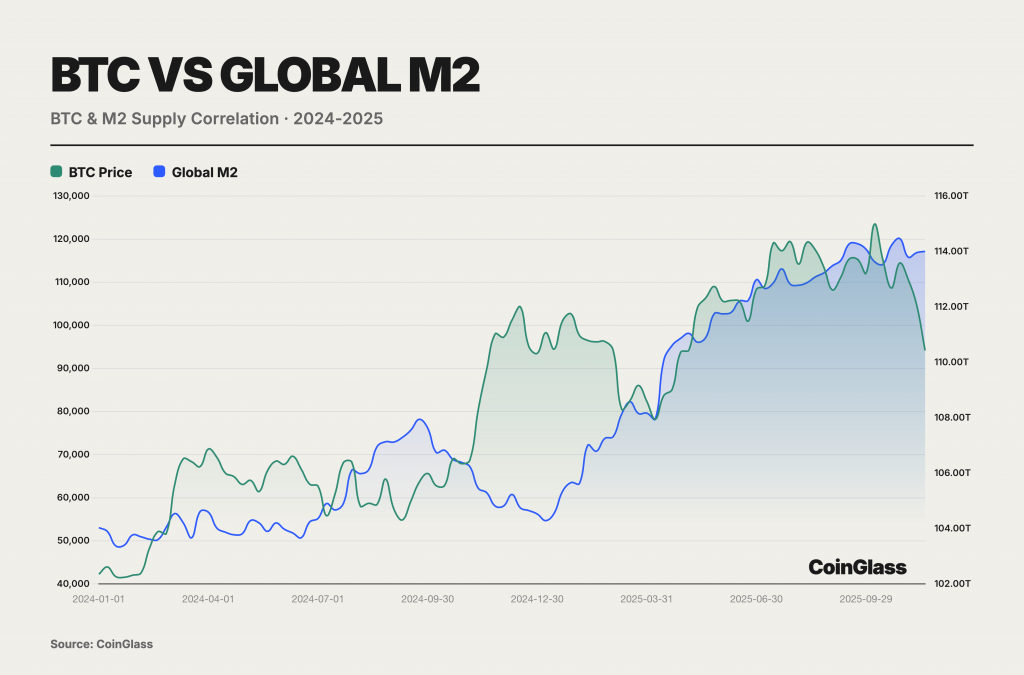
CoinGlass highlights a strong full-year correlation with global liquidity (global M2), while noting a structural decoupling later in the year. The practical takeaway is simple: BTC acted as a leveraged expression of liquidity expansion. When global liquidity expanded and the Federal Reserve entered a rate-cut cycle, BTC moved sharply higher—CoinGlass notes a move from $40,000 to $126,000, describing these returns as a function of high beta rather than “independent value discovery.”
What this means in 2026
In 2026, traders should treat macro liquidity as a first-class signal. If crypto behaves as high beta:
- Liquidity expansion can accelerate upside more than expected.
- Liquidity tightening can trigger faster drawdowns and liquidation cascades.
- Risk-off shocks can have disproportionate effects on leveraged derivatives positioning.
Macro uncertainty became a volatility engine
CoinGlass emphasises that geopolitical and policy uncertainty were critical in 2025, creating a rich derivatives narrative set. The report calls out:
- Renewed US–China trade friction
- The Fed balancing rate cuts against recurring inflation
- Bank of Japan policy normalization (carry-trade unwinds)
- A more crypto-friendly US policy stance
Net effect: sustained volatility, and “deep opportunities for strategic gaming” in derivatives—because narratives were frequent, market reactions were sharp, and positioning could become crowded quickly.
2026 implication
This environment rewards traders who:
- Track macro calendars and headline risk
- Watch open interest and funding/basis signals for crowding
- Avoid building portfolios that rely on “perfect” liquidation engines functioning under stress
Regulation: directional convergence, divergent pathways
CoinGlass describes 2025 regulation as “directional convergence with divergent pathways.”
- United States: moved toward legislation/licensing, reducing uncertainty associated with “regulation by enforcement.”
- European Union: continued a consumer-protection approach with tighter restrictions on high-leverage retail derivatives.
- Asia: remained fragmented—Mainland China strict; Hong Kong and Singapore positioned as compliant sandboxes.
- Notable milestone: Singapore Exchange (SGX) launched BTC and ETH perpetual futures, signalling selective integration of crypto-native products into traditional infrastructure.
- DeFi direction: “same activity, same risk, same regulation” emerging as a guiding principle.
2026 takeaway
As policy frameworks mature, the key differentiator becomes execution quality + risk controls, not just product availability. Traders should increasingly evaluate venue reliability during stress events, not only fees or leverage.
Exchange BTC reserves: destocking and the liquidity trap
CoinGlass reports a notable exchange-level supply shift in 2025:
- Exchange BTC reserves peaked near 2.98 million BTC (~April 22) and declined to ~2.54 million BTC by mid-November
- Net outflow: ~430,000 BTC (~15% decline)
The report interprets this as more than reduced short-term selling pressure. It reflects a structural shift toward lower turnover, long-term holding, and migration to self-custody.
Why it matters
Destocking can:
- Amplify upside during rallies (less tradable supply, higher marginal price impact)
- Also create a risk: if macro expectations reverse, a reflux of previously withdrawn reserves can hit a thinner order book, increasing volatility.
2026 takeaway
If you see falling exchange inventories alongside rising open interest, treat that combination carefully: the market can rally hard, but corrections can become sharp when liquidity thins.
Stablecoins, DATs, and RWAs: settlement meets finance
CoinGlass highlights the 2025 expansion of stablecoins and DATs alongside institutional RWA exploration:
- Stablecoin market cap temporarily breached $230B
- Annual on-chain settlement volume around $1.5T
- DAT-held BTC/ETH exceeded $140B at peak, up over 3x YoY (per report narrative)
- RWAs served as a bridge between real cash flows and on-chain settlement/valuation systems
The report also references a BCG–Ripple projection that tokenized assets could expand from ~$600B to ~$18.9T by 2033 (CAGR ~53%), which provides a “scale hypothesis” for the tokenization narrative.
2026 takeaway
Derivatives traders should track stablecoin growth and RWA momentum because it affects:
- Market settlement rails and liquidity availability
- Basis and cross-venue arbitrage capacity
- Demand for hedging instruments tied to tokenized exposures
Centralized derivatives exchanges in 2025: volume, open interest, and concentration
CEX derivatives trading volume: $85.7T and a “low start, high finish” year
CoinGlass reports:
- Total 2025 derivatives volume: ~$85.70T
- Daily average turnover: ~$264.5B
- Peak single-day volume (Oct 10): ~$748B
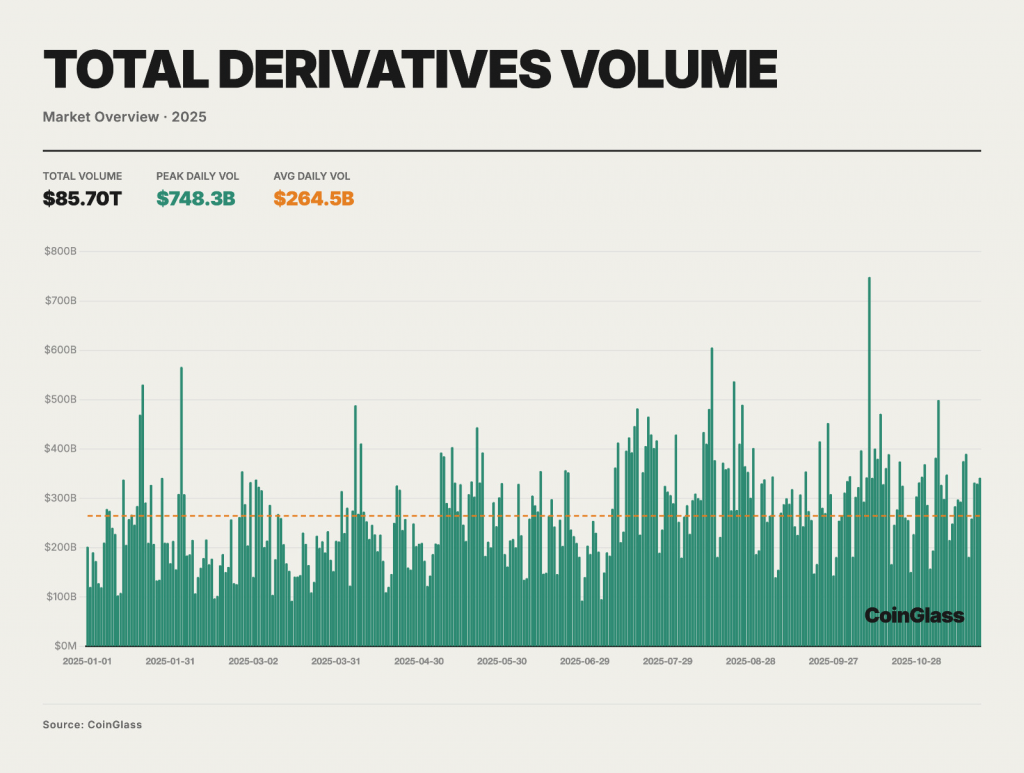
The year’s pattern is described as “low start, high finish, oscillating upward trend.” Importantly, derivatives are framed as the primary venue for price formation and risk management across mainstream assets.
Table: Key volume stats from the report
| Metric | CoinGlass 2025 figure |
|---|---|
| Total derivatives volume | ~$85.70T |
| Avg daily turnover | ~$264.5B |
| Peak single-day volume | ~$748B (Oct 10) |
Market share: a concentrated top tier and the platform “Matthew effect”
CoinGlass describes a highly concentrated market-share distribution:
- Binance: $25.09T total, $77.45B daily avg, ~29.3% share
- Second tier: OKX, Bybit, Bitget with total volumes ~$8.2T–$10.8T
- Top four combined share: ~62.3%
- Gate: ~6.9%
- Long-tail venues each around ~1% share
The report’s structural conclusion: top platforms reinforce themselves via liquidity moats, while mid/small platforms must find niche differentiation or face erosion.
2026 takeaway
Market concentration matters because it can turn operational or risk-control issues at major venues into systemic events.
Open interest: from deleveraging to a crowded peak, then a violent reset
CoinGlass outlines a volatile OI path:
- Yearly low around $87B after Q1 deleveraging
- Recovery in Q2, acceleration into Q3
- Peak OI: $235.9B (Oct 7)
- Early Q4 flash deleveraging: > $70B wiped in a day (about one-third of total OI)
- Year-end OI: $145.1B, still ~17% higher than the year start
Table: OI timeline markers
| OI phase | Report description |
|---|---|
| Q1 | Deep deleveraging; low around $87B |
| Q2 | Confidence rebuilding; position accumulation |
| Q3 | Bubble-like accumulation; crowded leverage |
| Early Q4 | Flash deleveraging; >$70B reduced |
| Year-end | $145.1B, +17% vs start |
Liquidity depth: execution capacity concentrated at the top
CoinGlass notes liquidity depth structure differs from OI:
- Binance dominates BTC depth (reported at $536M), with a large lead
- OKX is strong second (BTC depth $202M, ETH $147M)
- Bitget shows meaningful depth in BTC/ETH and even SOL in the report’s examples
2026 takeaway
Liquidity depth is not a vanity metric. It dictates:
- Slippage under stress
- How liquidation engines translate into actual market impact
- Whether large players can hedge without destabilizing price
User asset holdings: extreme custody concentration
CoinGlass describes a highly concentrated custody structure (HHI ~5352 in their analysis), with:
- Binance holding a very large share (report narrative indicates >72%)
- OKX second
- Bybit/Gate/Bitget forming a sub-leading tier
- Top 5 platforms absorbing >90% of user assets (as described)
2026 takeaway
When custody concentration is extreme, platform risk becomes market risk. Traders should consider:
- Diversifying collateral exposure
- Understanding withdrawal/transfer behavior during stress windows
- Having contingency plans when cross-platform corridors congest
Liquidations in 2025: when risk systems were truly tested
$150B nominal forced liquidations and one defining stress window
CoinGlass reports:
- Total forced liquidations (long + short) around $150B for 2025
- Typical days: tens to hundreds of millions
- Extreme window: Oct 10–11
Oct 10–11 event: the anatomy of a liquidation cascade
CoinGlass describes Oct 10 as the peak liquidation day:
- Combined liquidations exceeded $19B
- The report suggests actual nominal liquidation may have approached $30–40B considering timing and market-maker feedback
- Long side dominated: ~85–90% of liquidations
The trigger (per report narrative) was an exogenous macro shock: an escalation in trade measures leading global risk assets into risk-off mode. But CoinGlass emphasises the magnitude was determined by pre-existing leverage and the design of liquidation/ADL mechanisms.
Why this matters more than the headline number
The report’s deeper point is about infrastructure under stress:
- Market-price liquidations consumed order-book liquidity quickly
- Insurance funds struggled on some venues
- Auto-Deleveraging (ADL) activated in ways that created concerns around transparency and execution deviation from fair market prices
- Cross-platform transfers congested; hedging corridors partially broke
- Liquidity providers widened spreads or stepped back
- Lacking circuit breakers, prices slid further under liquidation-driven order books
Uneven outcomes: majors vs long-tail assets
CoinGlass contrasts outcomes:
- BTC/ETH drawdowns ~10–15% (as described)
- Many altcoins/long-tail assets saw extreme retracements (80% or near-zero)
2026 takeaway: the “hidden risk” is portfolio mutation
One of the most useful lessons from the report is how portfolios that look neutral can become directional under stress:
- Hedges can be forcibly reduced
- ADL and liquidation mechanics can dismantle one leg
- Transfer congestion blocks re-hedging
Result: “neutral” strategies can suddenly behave like high-beta directional risk.
Exchange-traded derivatives and DAT: where institutionalization concentrated
CME’s structural ascent and the normalization of basis trading
CoinGlass positions 2025 as the year CME cemented itself as the global center for crypto pricing and risk transfer:
- Institutional capital evolved from passive exposure (spot ETFs) to active derivatives usage
- The liquidity moat between compliant exchange-traded markets and offshore venues was “reconstructed”
- Basis trading scaled alongside ETF AUM growth, forming a major linkage between TradFi rates and crypto yields
Spot-quoted futures and the next step: volatility products
CoinGlass highlights innovation like spot-quoted futures (QBTC/QETH) intended to tighten spot linkage and reduce basis risk/roll cost. The report also suggests the CME BTC Volatility Index (BVX) could pave the way for tradable volatility futures in 2026.
2026 takeaway
As exchange-traded infrastructure matures, the edge moves toward:
- Efficient basis capture when mispricings appear
- Lower friction in hedging
- Better-defined risk transfer tools (including volatility instruments)
DAT: the corporate balance-sheet flywheel
CoinGlass explains DATs as public companies shifting a substantial portion of reserves to crypto assets and using financing tools (convertible notes, ATM offerings) to increase coins per share—the “DAT Flywheel.”
The report notes:
- Public DAT BTC holdings increased from ~600,000 BTC to ~1.05M BTC by November (aggregate)
- “Strategy” increased holdings (report narrative) and the sector shifted from single-whale dominance to a mega-whale + long-tail structure
- Even when equity premiums compressed later, holdings did not reverse materially; repricing happened at the equity layer more than on the asset side
2026 takeaway: risk shifts from token price to financing structure
CoinGlass argues DAT risk is less about predicting BTC’s next move and more about:
- Financing structures
- Governance
- Regulatory impacts
- Macro hedging logic
This becomes especially important if liquidity turns and equity premiums compress while token prices retrace (the “double kill” risk described).
Options market: volatility pricing power shifts
CoinGlass identifies two milestone events:
- Coinbase acquisition of Deribit (report narrative) integrating crypto-native options liquidity into a compliant exchange pathway
- IBIT ETF options rising and overtaking Deribit in BTC options OI by late 2025 (as described)
The report frames 2025 as a “dual-track” world:
- Crypto-native options liquidity (Deribit) remains central, especially in ETH options
- Traditional channels (ETF options like IBIT) become dominant in BTC options flows due to institutional accessibility
2026 takeaway
Watch where volatility pricing power sits. When options liquidity migrates to more compliant channels:
- Market makers, flows, and volatility surfaces can change
- Hedging costs and availability can shift quickly
- BTC and ETH may diverge depending on product approvals and institutional uptake
DeFi derivatives in 2025: Perp DEX goes from concept to market share
Perp DEX: explosive growth and a move toward multipolar competition
CoinGlass describes 2025 as a breakout year:
- Monthly on-chain perp volumes surpass $1.2T in October
- Hyperliquid led early with dominant share, then competition intensified later with new entrants gaining share (as described in your pasted content)
A key narrative is architectural: high-performance app chains and intent-centric design lowered friction and improved execution quality, making on-chain derivatives a functional alternative in certain niches (censorship resistance, composable strategies).
2026 takeaway
Perp DEX is no longer just a “DeFi niche.” It influences:
- Market share at the margins
- Venue competition and fee structures
- Trader expectations around UX and capital efficiency
Prediction markets and wallets: the application layer matures
CoinGlass also highlights:
- Prediction markets reaching large volumes and user metrics (as described)
- Wallets evolving into on-chain traffic gateways integrating identity, DApps, and abstraction layers
- Account abstraction and chain abstraction reducing onboarding friction
- Security architecture upgrades (MPC + TEE) becoming standard among top wallets
2026 takeaway
Distribution and user experience increasingly shape trading behavior. As wallets and apps become the new gateways, derivatives participation can expand beyond traditional exchange-centric funnels.
What this report means for traders in 2026
1) Market structure matters as much as direction
In 2025, direction was often a liquidity story—but the biggest outcomes came from structure:
- OI crowding
- Thin order books
- Venue concentration
- Transfer congestion
- Liquidation and ADL mechanics
In 2026, traders should evaluate “where” a trade sits, not only “what” asset it is.
2) Tail risk is amplified by complexity
CoinGlass repeatedly points to deeper leverage chains and complex cross-platform strategies increasing tail risk. The lesson is not “avoid derivatives.” The lesson is: don’t assume infrastructure behaves ideally under stress.
3) Opportunities exist in basis and compliant tool integration
CoinGlass highlights basis trading normalization and the coupling of ETF flows with futures hedging. Traders should watch basis regimes and how quickly they compress when arbitrage channels deepen.
4) The next competitive edge is liquidation resilience
CoinGlass ends with a forward-looking focus: 2026 competitiveness depends on whether trading infrastructure maintains resilience in crowded leverage chains and whether capital can circulate efficiently between compliant and decentralized realms.
India Snapshot: What the 2025 Derivatives Shift Looked Like Locally (and Why It Matters in 2026)
While the CoinGlass 2025 annual report focuses on global market structure, the same “derivatives-first” shift was visible in India as well — driven by a combination of trader preference for leverage, faster execution, and market structure incentives.
India market signals (2025–early 2026)
| Metric / Signal | India-specific data point | Why it matters |
|---|---|---|
| Crypto futures activity on Indian platforms | Industry estimates cited by ET BFSI suggest daily crypto futures trading on larger Indian platforms averages ~$3–5 million (as of Sept 2025). | Shows a measurable local derivatives layer even under tighter conditions vs global markets. |
| Exchange-reported annual volume (India) | A Binance Square post referencing CoinDCX states CoinDCX reported ₹51,333 crore trading volume in FY25. | Helpful “India scale” indicator, even though this is platform-reported and not a full market total. |
| India’s shift toward futures vs spot | A Times of India report notes futures trading surpassing spot activity in India, linked to leverage demand and product structure. | Matches CoinGlass’s global conclusion: derivatives dominate price discovery and participation. |
| Broader “derivatives mindset” in India | SEBI reported Indian retail losses in equity derivatives rose to ₹1.06 trillion in FY2025 (a separate market from crypto, but relevant for trader risk behavior). | Reinforces why risk controls, leverage discipline, and liquidation resilience matter for Indian traders too. |
| Adoption breadth beyond metros | A Times of India report quotes CoinDCX CEO: ~40% of CoinDCX users come from tier-2/3 cities; Indore participation cited as unusually high. | Suggests derivatives-style trading interest is spreading beyond top metros, changing how exchanges should educate users. |
What this means for Indian derivatives traders in 2026
CoinGlass describes 2025 as the year the market shifted from “retail leverage speculation” to an environment dominated by institutional capital + compliant rails + on-chain alternatives. In India, the local version of that shift is showing up as:
- Growing comfort with futures-style products (even if absolute volumes are smaller than global venues).
- A stronger need for transparent risk systems (margin rules, liquidation handling, execution reliability) because Indian traders already participate heavily in derivatives behavior in other asset classes too.
- A wider audience entering the market from tier-2/3 regions, which increases the importance of education around leverage and volatility.
Editorial note (for compliance): India figures above include industry estimates and exchange-reported numbers; they are not a complete measurement of the entire Indian crypto derivatives market.
Conclusion: 2025 repriced the derivatives world, 2026 tests the plumbing
CoinGlass’s core conclusion is that 2025 repriced crypto derivatives around three forces: institutional capital, compliant infrastructure, and on-chain technology. Macro liquidity set the trend; geopolitics and policy shifts acted as triggers; and the October liquidation window revealed how fragile the margin–liquidation–insurance fund–ADL chain can be under congestion.
In 2026, the important question is not whether derivatives will keep growing—they likely will. The more relevant question is whether the ecosystem can absorb stress without turning localized shocks into systemic events. For traders, that means building strategies that respect market structure, liquidity, and execution constraints—not just price direction.
Disclaimer
This article is a commentary based on the CoinGlass 2025 Crypto Derivatives Market Annual Report text shared by the user. It is for informational purposes only and does not constitute investment, legal, tax, or financial advice. Crypto derivatives involve significant risk and may not be suitable for all participants. Past performance is not indicative of future results. Please consult qualified professionals before making trading decisions.