Golden Cross Pattern is well considered to be one of the most reliable chart pattern used by crypto traders in predicting bullish trends. It shows a signal of change in momentum whenever a short-term moving average crosses above a long-term moving average. Therefore, it is basically that type of pattern that helps recognize key market moments when the market changes from a bearish to a bullish trend.
What do we learn here in this guide?
We are going to discover what the Golden Cross Pattern is, how it forms, how we are able to apply it for trading with platforms such as Pi42, and how to manage risks efficiently.
What is the Golden Cross Pattern?
The Golden Cross is a chart pattern that indicates a breakout to the upside may be imminent. According to legend, the event takes place when a shorter-term average, normally the 50-day moving average, crosses over a longer-term average, often the 200-day average. A bullish signal is indicated by this cross because upward price momentum is gaining strength and may continue for at least a short interval.
The Golden Cross Pattern occurs in three separate steps:
1. Bearish Trend Exhaustion: The market is currently in the bearish trend; short-term moving averages are slightly below the long-term moving averages.
2. Crossover: The short-term moving average (for instance, 50-day) crosses above the long-term moving average (for instance, 200-day), which means the trend in the market is changing from bearish to bullish.
3. Bullish Confirmation : The price keeps going up following the crossover.
Using this pattern, a trader will anticipate that the market will keep going up, probably representing an excellent signal for long positions within the crypto market.
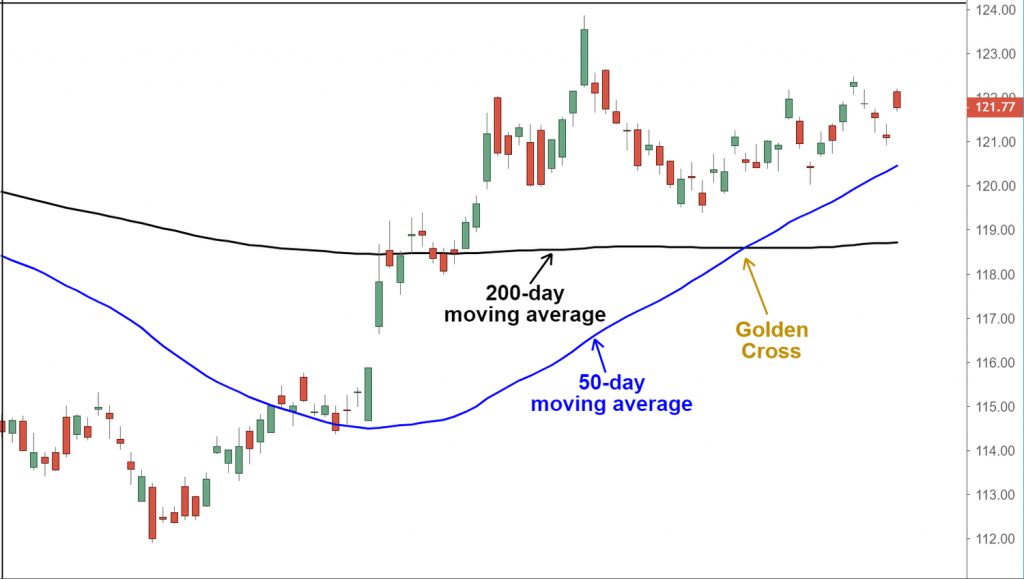
Chart Example
In order to illustrate this interpretation of the Golden Cross, plot these two moving averages on the price chart: 50-day and 200-day. Then, for this situation of when the short-term average crosses above the long-term average, a Golden Cross is interpreted as signifying the formation and is sometimes believed to be a buy signal. It proves to be very useful in determining scenarios in which the asset has ongoing upward trends-for example, in Bitcoin (BTC) and Ethereum (ETH).
Golden Cross in Action: Identifying Opportunities on Pi42
Advanced charting, such as that offered by Pi42, will be able to pick up trading opportunities in the Golden Cross scenario. Thus, traders would be able to find potential upswings early and take positions on the trajectories, like BTC/INR, ETH/INR, or other crypto pairs.
Now, on Pi42 traders can set alerts that will inform them of a Golden Cross pattern, so they don’t miss those trends. After identifying a trend set by a Golden Cross, enter a long position and ride the trend, hopefully capturing the natural movement that follows.
For instance, when the Golden Cross shows for Ethereum (ETH) on the 4-hour or daily chart, that usually confirms it’s going into a bullish wave. The sooner you are getting in, the better your chances of making profits from the trend.
More Than Just the Golden Cross
While the Golden Cross is, in fact, a useful pattern to identify bullish trends, you should keep looking for other factors to ensure that your trades are mostly based on in-depth analysis.
The Golden Cross as a Lagging Indicator
One should note that the Golden Cross is a lagging indicator, implying the price movement has already commenced at the time of the crossover. Since the crossover in a Golden Cross happens after the onset of a trend, some of the price movement may have been captured by the earlier movements, so much so that this crossover will not be of too much use when trying to enter the trade based upon it alone.
But market fundamentals-the good news or growing trading volume-might reinforce the signal generated by the Golden Cross and therefore increase your confidence to place any trade.
Golden Cross vs. Death Cross
While the Golden Cross indicates a bullish trend, its opposite of it is known as the Death Cross. It is an indication that perhaps the markets may turn bearish. The Death Cross occurs when the short-term moving average falls below the long-term moving average’s trend. In this case, one can infer that downward momentum is gathering. Awareness of both patterns gives traders the opportunity to catch changing market directions to take necessary actions.
How to Confirm the Golden Cross?
The best indicators for confirming the golden cross pattern are –
- Moving Averages (MA): The fundamental indicator for spotting a Golden Cross is the moving average, particularly the 50-day and 200-day moving averages. A crossover between these indicates a shift in trend.
- Relative Strength Index (RSI): The RSI helps determine if the asset is overbought or oversold, confirming whether the bullish signal from the Golden Cross is strong.
- Moving Average Convergence Divergence (MACD): This indicator provides additional confirmation by showing momentum strength and crossover signals between short-term and long-term moving averages.
Trading with Caution: Managing Risk on Pi42
Although this is an extremely powerful tool, trading on the crypto market is highly leveraged and requires proper risk management, mainly considering volatility.
Some tools available on Pi42 platforms include several designed to help traders to properly manage their risk while trading on a Golden Cross basis.
Stop-Loss Orders
A stop-loss order is vital in protecting your trades. A stop-loss ensures that in the event of a market move against your position, your losses are limited by the automatic trade exit at a predetermined price. For instance, once you have identified a Golden Cross and have gone long, you can place a stop-loss to implement just below the last swing low. This will serve as protection in your case if the market turns against you rapidly.
Position Sizing
The correct position sizing is significant to the management of risk. It means taking appropriate measures to limit exposure to capital on one trade so that your overall portfolio is not devastated by big drawdowns. You can easily manage position sizes so that no individual trade risks too much of your capital on Pi42. For instance, risking only 1-2% of your total capital in one trade ensures that, in case there is a loss, your portfolio is safe.
Conclusion
The Golden Cross Pattern has developed to be one of the most effective chart patterns to determine the prospect of a bullish trend in the crypto market. From learning how it is formed and using it along with other technical indicators, a trader is well placed to make efficient decisions on how to adequately trade the market. More importantly, there should also be risk management skills to effectively use tools like stop-loss orders and position sizing, which any platform, including Pi42, allows for.
Whether you are a beginner or an accomplished trader, the Golden Cross will indeed be one of the excellent additions to your overall trading plan for determining bullish trends and optimizing entry points. But remember, the golden saying is that no single technical indicator can ever be considered infallible, so those signals need to correspond further analysis and appropriate market context. With good technical analysis and risk management, you’ll be prepared for the volatile crypto markets.
Frequently Asked Questions
1. Is a golden cross bullish or bearish?
A Golden Cross is bullish, signaling a potential uptrend when a short-term moving average crosses above a long-term moving average.
2. What is the Best Indicator for the Golden Cross?
The MACD indicator is the best for confirming a Golden Cross, as it validates momentum and trend strength.
3. What Indicators to Use with Golden Cross?
Use MACD, RSI, volume indicators, and Bollinger Bands to confirm the Golden Cross and improve accuracy.
DISCLAIMER : Crypto products and NFTs are unregulated and can be highly risky. There may be no regulatory recourse for any loss from such transactions.