With the rising popularity of cryptocurrency trading, the demand for effective technical indicators increases as well. The Ichimoku Cloud offers unique insights into market trends, momentum, and possible points of reversal. Originated in Japan, this indicator has seen growing uses lately in the arena of cryptocurrency trading due to its versatility and the ability to actually pinpoint relevant trends in the markets.
This blog will introduce the Ichimoku Cloud indicator, break it down into its components, and give practical recommendations on how to improve decision-making for cryptocurrency trading.

The Ichimoku Cloud Indicator: Understanding the Concept
The Ichimoku Cloud, or Ichimoku Kinko Hyo, is an all-encompassing technical indicator that clarifies price movement, trend orientation, momentum, and support and resistance levels.
Origin and History of the Ichimoku Cloud
Goichi Hosoda, a Japanese author, first proposed the Ichimoku Cloud in the 1960s as a way to offer a comprehensive view of market circumstances. “Ichimoku Kinko Hyo” means “onelook equilibrium chart,” in which it presents the comprehensive overview of the market with just a single look.
Key Elements of the Ichimoku Cloud
Each element of the Ichimoku Cloud has a specific purpose:
Tenkansen (Turning Line): The short-term trend line is achieved by averaging the high for the highest and the low for the lowest of the previous 9 periods.
Kijunsen (Standard Line): The long-term trend line is calculated over a period of 26. It serves as an indicator showing the equilibrium of the market.
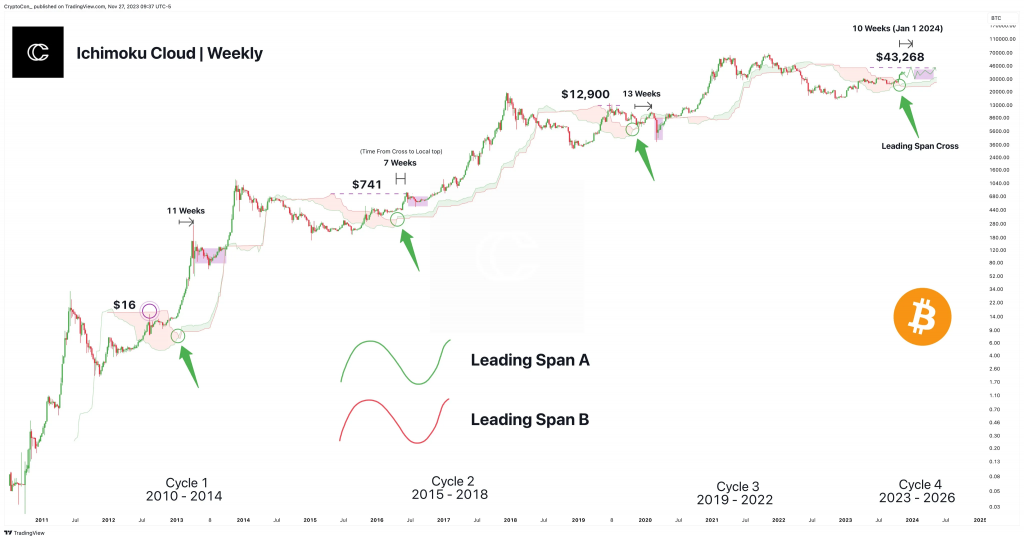
Senkou Span A and B (Leading Spans): These are together known as the “cloud.” They are support and resistance levels.
Chikou Span (Lagging Line): This is a lagging indicator that shows market sentiment and indicates some probable areas of support and resistance points.
Role of the Ichimoku Cloud in Crypto Trading
Tenkansen and Kijunsen: Turning and Standard Lines
These form the basis of the Ichimoku Cloud:
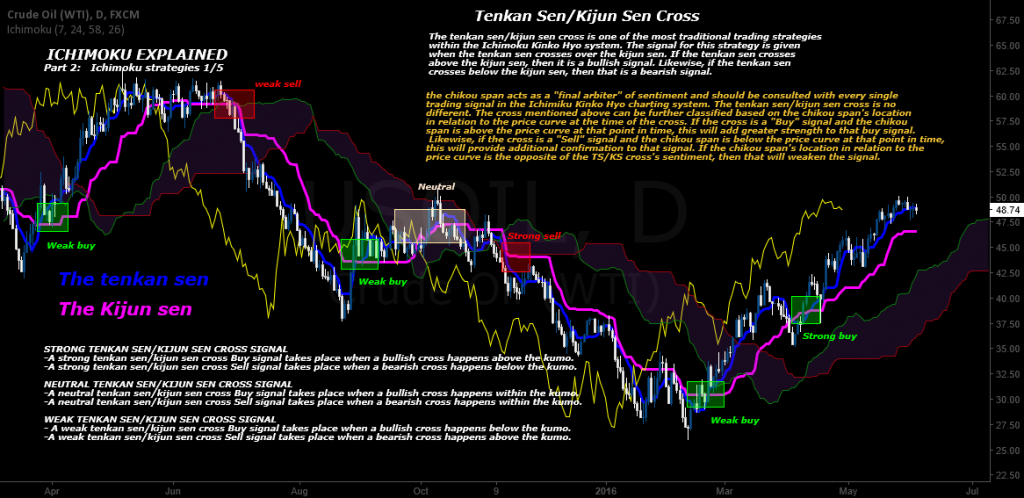
Tenkansen: This one shows short-term momentum. If it is above the Kijunsen, then that indicates an upward trend.
Kijunsen: This is the support and resistance level. A price above this line is a positive trend, while one below shows a negative trend.

Senkou Span A and B: Describe the Cloud
Senkou Span A (Leading Span A): This is a total average of the Tenkansen and Kijunsen
Senkou Span B (Leading Span B): This is the highest high and lowest low for the past 52 bars.
These periods combined make up the cloud (kumo), which acts as a moving support and resistance.
When prices are above the cloud, then they may appear bullish; when below, it is bearish.
Chikou Span: Lagging Indicator
The Chikou Span gives the price action a retro look. When the price is higher, the emotion is high; when it does not come close, the sentiment is poor.
Advantages of Using the Ichimoku Cloud when Trading Cryptocurrencies
For a cryptocurrency trader, the Ichimoku Cloud offers the following benefits.
Identifying Trends and Momentum
The color and position of the cloud against the price show just how strong the trend is. On the other hand, observing the relationship between the price and the cloud can gauge how bullish or bearish the momentum in the market is.
Clouds are used for supporting and resisting when price action reaches the cloud. It can act as a barrier at the levels of the cloud when prices are approaching it, slowing down or reversing the trend.
Improving Trade Timing and Decision Making
When a trading system has clear-cut support and resistance levels, traders are able to enter and exit trades with better timing, leading to superior overall profitability.
Formulating a strategy through the use of the Ichimoku Cloud is rather simple, as it encompasses a mixture of trend-following indicators and adaptive support/resistance levels.
Basic Configuration of Ichimoku Cloud
1. A determination of the trend: If the price remains above the cloud, it generally suggests a bullish trend, but if the price is below the cloud, then it usually denotes a bearish trend.
2. Crosses: A buy signal occurs when the Tenkansen crosses over the Kijunsen; conversely, bearish signals come when it goes lower.
3. Observe the Color of the Cloud: A green-colored cloud indicates that there is positive momentum, while a red-colored one indicates that conditions are bearish.
Combination with Other Indicators
The more studies that can be done with the use of Ichimoku Cloud together with volume indicators, MACD, or RSI, will assist in the confirmation of the signals and higher accuracy of entry/exit positions.
Risk Management and Position Sizing
Use appropriate position size to limit your risk, as with any strategy. Putting stop-loss orders underneath support levels for long positions or over the resistance levels for short positions could limit your losses.
Practical Examples of Implementing the Ichimoku Cloud
Case Studies in Cryptocurrency Trading: Real-World Evidence
Imagine such a scenario where the Bitcoin price begins to pierce through the clouds, along with a bullish Tenkan-sen/Kijun-sen crossover. The combination with a volume confirmation might be an ideal time to enter a long.
Analysing Past Market using Ichimoku
Testing the past data using the Ichimoku Cloud helps the traders understand how it reacts to various market conditions that leads to better future trading decisions.
While using the Ichimoku Cloud, There are Many Mistakes to be Avoided
The Ichimoku Cloud is very powerful, yet improper use may yield some negative effects.
Incorrect Signals in the Cloud Interpretation
Reading signals from the cloud involves experience. Never enter a trade based on Tenkansen / Kijunsen crossovers without reference to the current trend of the market.
Overcomplicating the System
Have a strategy. The Ichimoku Cloud works well on its own and does not require many indications.
Ignoring Market Environment and Fundamentals
Always consider more market conditions and aspects, as these may influence the efficiency of the Ichimoku Cloud.
Conclusion
The Ichimoku Cloud is really a very useful indicator for cryptocurrency traders to grasp the trend, support, resistance, and momentum. By studying its components and implementing them with a well-thought-out strategy, the trader will be able to fine-tune their decision-making and possibly improve their performance in the cryptocurrency market.
Frequently Asked Questions
1. What is the Ichimoku Cloud, and what does it use for trading?
This cloud can be described as a technical indicator, within which trends, momentum, and reversal points are estimated.
2. What do Tenkansen and Kijunsen do in the Ichimoku Cloud?
Tenkansen is the turning line (short-term trend). Kijunsen is the standard line (long-term trend), which is supposed to give bullish or bearish indications by its crossing.
3. Is the Ichimoku Cloud a good trading tool for cryptocurrencies?
Absolutely, and its use in cryptocurrency trading is very high in terms of trend evaluation as well as levels of support and resistance.
4. How many times do you fall into the following traps when trading with the Ichimoku Cloud?
Avoid overcomplicating tactics and reading them out of context without other forms of confirmation.
5. How do you create a trading strategy with the Ichimoku Cloud?
Use the strategy to identify trends, monitor crossing lines, and make use of the stoploss order to limit the risk.
DISCLAIMER : Crypto products and NFTs are unregulated and can be highly risky. There may be no regulatory recourse for any loss from such transactions.

