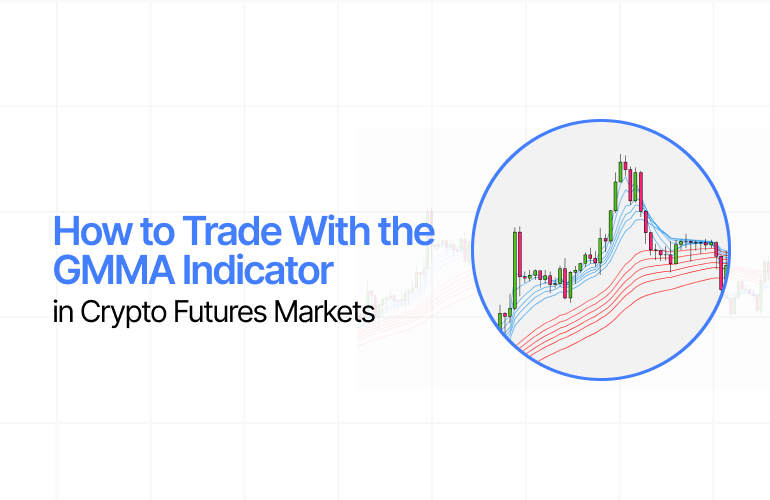
Pi42 Blog

India's 1st Crypto-INR Perpetual Futures Trading Platform

Pi42 Blog

India's 1st Crypto-INR Perpetual Futures Trading Platform

technical indicators

What is Relative Vigor Index Indicator & How to Use it in Crypto Trading?

The Relative Vigor Index (RVI) is a momentum oscillator that compares a candle’s close with its open, normalised by the day’s range. On Pi42, India’s first crypto-INR perpetual futures platform, this tool helps traders refine entries and exits across BTC-INR, ETH-INR, SOL-INR, MATIC-INR, and XRP-INR contracts. How to Read the Relative Vigor Index Indicator? The […]

What is Commodity Channel Index Indicator & How to Use it for Crypto Trading

The CCI indicator is a momentum oscillator that helps traders spot any movements or shifts in market strength, potential reversals, and price extremes. Developed by Donald Lambert in 1980, it first measures how far today’s price has deviated from its recent average. Then, it converts that deviation or difference into an index. How does the […]

What is a Bollinger Band Squeeze?

Bollinger Bands are a popular technical analysis tool that helps traders measure market volatility. They consist of a simple moving average (SMA) and two standard deviation bands that expand and contract based on price movements. When volatility decreases significantly, the bands squeeze together, signalling a potential breakout. Learn more: Bollinger Bands Explained: What They Are […]

Understanding Volatility Indicators in Crypto Trading

Pi42 was built for India’s fast-moving crypto traders. As the country’s first crypto-INR perpetual futures exchange, it offers INR-margined contracts, tax efficiency, and an intuitive charting interface where you can add leading volatility indicators directly to your trading view. That combination helps you read risk, plan entries and exits, and act decisively in a market […]

Top 10 Best Technical Indicators for Crypto Trading

Crypto trading is highly volatile, making it essential for traders to use technical analysis to make informed decisions. Technical analysis for crypto involves studying historical price data, market trends, and volume to predict future price movements. By utilising the best indicators for crypto trading, traders can gain an edge in identifying entry and exit points, […]

Types of Technical Indicators for Crypto Trading

IntroductionIn the fast-moving world of crypto trading, making decisions based on gut feeling alone can be risky. That’s where technical indicators come in. These tools help traders analyze market trends, momentum, and potential entry or exit points. Whether you’re a beginner or experienced trader, understanding the different types of technical indicators can enhance your strategy. […]

What is Relative Strength Index (RSI) Indicator & How to Use it in Crypto Trading?

The Relative Strength Index (RSI) is a momentum oscillator that measures the speed and magnitude of price movements. Developed by J. Welles Wilder, this technical analysis tool helps traders identify whether a crypto asset is overbought or oversold, making it a valuable tool for decision-making. The RSI ranges from 0 to 100 and is typically […]

Scroll to top