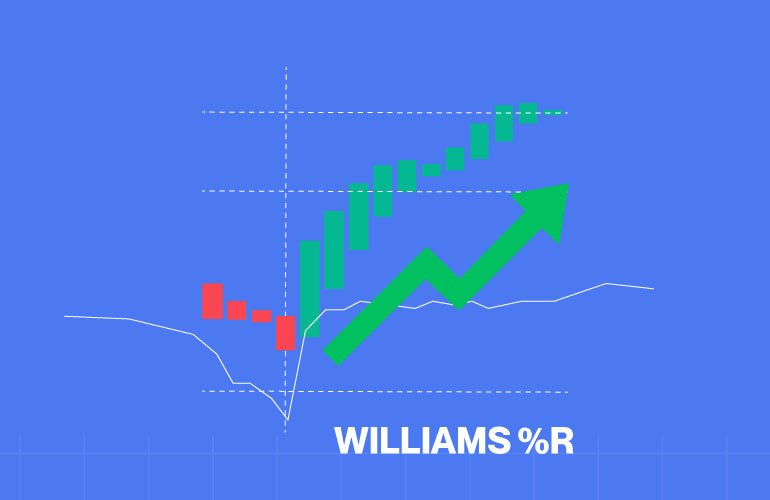
Successful crypto trading depends on spotting momentum shifts before the crowd does. One underrated but powerful momentum indicator is the williams r indicator in crypto. Designed to identify overbought and oversold conditions, williams %r can help you time your entries and exits more effectively. In this blog, we’ll break down what it is, how it works, and how to use williams r indicator in crypto trading strategies.
What is the Williams %R Indicator?
Williams %R, also called Williams Percent Range, is a momentum oscillator developed by Larry Williams and widely used as a williams r technical indicator. It compares a crypto asset’s closing price to its high-low range over a set number of periods (usually 14).
Range: -100 (most oversold) to 0 (most overbought)
Zone Interpretation:
0 to -20: Overbought zone (potential sell)
-80 to -100: Oversold zone (potential buy)
Unlike RSI, which starts at 0 and goes up, williams r starts at 0 and goes down.
How to Read Williams %R in Crypto
1. Spot Overbought and Oversold Conditions
If williams %r is near -100: The crypto may be undervalued (potential buy)
If williams %r is near 0: The crypto may be overvalued (potential sell)
2. Identify Trend Reversals
Sharp movements in the williams r indicator in crypto from overbought to oversold (or vice versa) often precede a trend reversal.
Combine with price action and volume for confirmation.
3. Confirm Entry/Exit Signals
Use the williams r indicator in combination with moving averages or candlestick patterns to validate signals.
This section explains how to read williams r indicator effectively in real market conditions.
How to Use the Williams %R Indicator on Pi42
Pi42, a zero-fee crypto futures trading platform, offers integrated charting tools that include the williams r indicator. Here’s how you can apply it:
Step 1: Log in to your Pi42 trading account at pi42.com
Step 2: Open any crypto futures trading pair and go to the chart interface.
Step 3: From the indicators section, search for “Williams %R” and apply it to your chart.
Step 4: Adjust the default period (typically 14) if needed, based on your trading timeframe.
Step 5: Use the indicator in combination with support/resistance levels or EMAs for more accurate signals.
Pi42 makes it simple for traders to understand how to use williams r indicator within an advanced trading environment.
Williams %R Trading Strategy for Crypto
Strategy: Combine Williams %R with Moving Averages
Look for buy signals when %R is below -80 and price crosses above a short-term moving average (e.g., EMA-9).
Look for sell signals when %R is above -20 and price drops below the moving average.
This approach forms a commonly used williams r indicator strategy among momentum-based crypto traders.
Scalping Tip: On lower timeframes (1-min to 15-min), williams r indicator in crypto can quickly indicate reversal zones for active day traders.
Swing Trading Tip: On 4H or daily charts, use %R to time entries near major support/resistance zones.
Limitations of Williams %R
- False Signals in Sideways Markets: The indicator may show frequent whipsaws.
- Should Be Used With Other Indicators: Works best when paired with MACD, RSI, or moving averages.
- Doesn’t Indicate Strength: Only shows potential reversals, not the magnitude of a move.
Conclusion
Williams %R is a simple yet effective momentum oscillator for identifying reversal points in crypto trading. By mastering the williams r indicator in crypto and combining it with other tools, traders can improve timing and reduce emotional decisions. Platforms like Pi42 make it easy to apply indicators such as williams r technical indicator in real time using professional-grade charting tools.
Frequently Asked Questions
What other indicators can I use with Williams %R?
You can pair it with RSI, MACD, Bollinger Bands, or moving averages for better confirmation.
Is Williams %R good for beginners?
Yes, it’s easy to read and ideal for spotting overbought/oversold zones.
Can I use Williams %R for intraday trading?
Absolutely. It’s frequently used by intraday and swing traders on shorter timeframes.

