
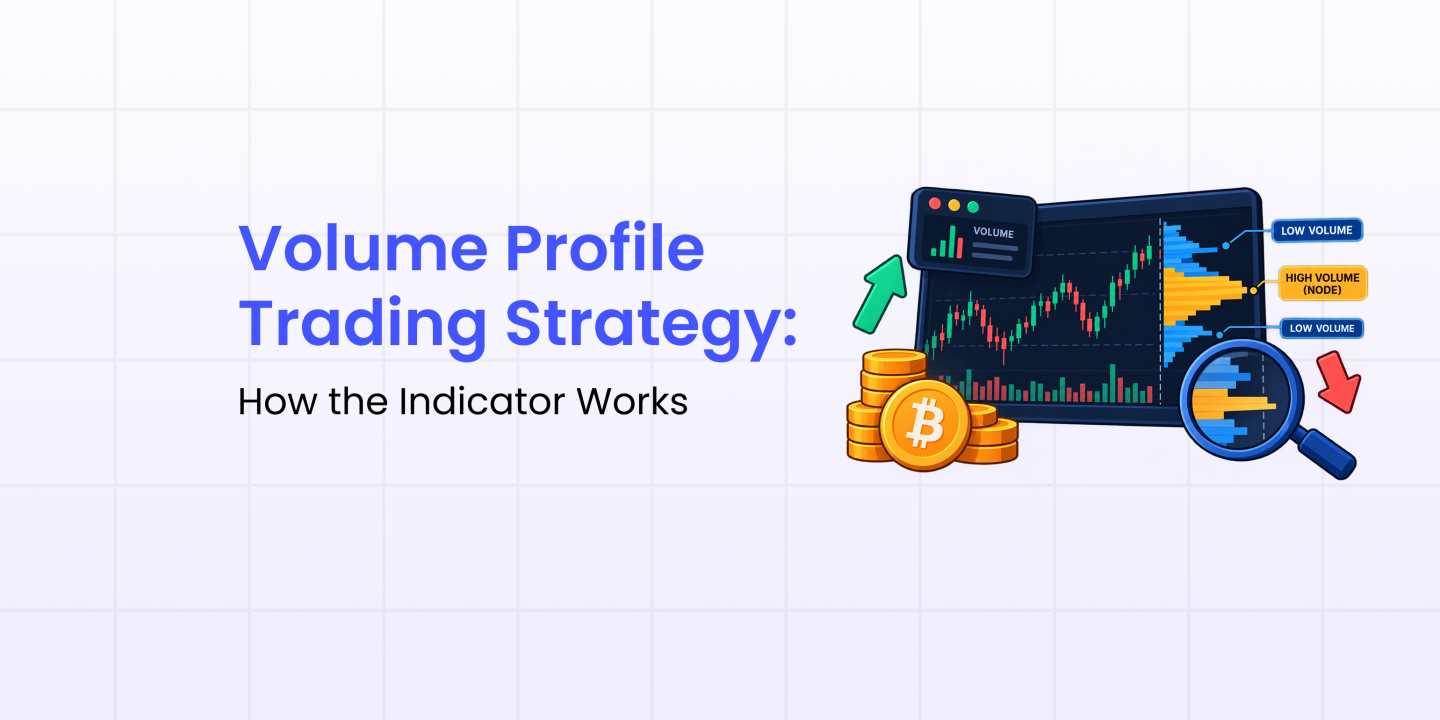
Most traders watch volume as a row of bars beneath the chart, which answers only when activity occurred. A volume profile trading strategy answers a more useful question for futures traders: at which price levels did that activity actually take place?
What is Volume Profile in Trading?
Volume profile is a volume-by-price indicator. It plots a horizontal histogram (a bar chart turned sideways) alongside price, showing how much volume traded at every price level over a chosen period. Anyone asking what is volume profile in trading can think of it as a map of participation rather than a clock.
Four components matter most:
- High Volume Node (HVN): a price level with heavy activity, often treated as fair value.
- Low Volume Node (LVN): a thinly traded level that price tends to pass through quickly.
- Point of Control (PoC): the single price with the highest traded volume, which frequently acts as a magnet.
- Value Area (VA): the band holding roughly seventy per cent of volume, bounded by the Value Area High and Value Area Low.
How Does the Volume Profile Indicator Work?
The indicator divides a selected range into price rows, totals the volume executed in each row, and draws a bar proportional to that total. Longer bars mark levels the market accepted; shorter bars mark levels it rejected. That’s how volume profile indicator works across any timeframe.
Traders can anchor the calculation in several ways:
- Visible range: covers whatever appears on screen, useful for quick intraday planning.
- Session profile: resets each day and suits short-term crypto futures setups.
- Composite profile: spans weeks or months and reveals longer-horizon acceptance zones.
Volume Profile Trading Strategies
A profile describes structure, not direction, so confirmation remains essential. Three approaches are widely used:
- High volume node retests. A high volume node tends to act as resistance while price trades below it and as support once price trades above it. This complements traditional methods of How to Identify Support and Resistance.
- Low volume node breakouts. Thin levels offer little friction, so a decisive move through one can extend rapidly. Stops usually sit on the far side of the node.
- Value area rotations. Price often rotates between the Value Area Low and High during balanced sessions, while acceptance outside the band suggests trend continuation.
Confluence strengthens each setup. Pairing profile levels with Volume Indicators. Momentum tools or established Crypto Chart Patterns filter weaker signals.
The Bottom Line for Crypto Futures Traders
A volume profile trading strategy gives traders a structural read on where participation has concentrated, which supports sharper entries and better-defined risk. It does not predict direction on its own and performs poorly in thin markets, so position sizing and stop placement remain critical.
Traders exploring Crypto F&O Trading in India can apply these levels to INR-settled perpetual futures on Pi42, where trades are free from the one per cent TDS applicable to spot transactions. Leverage magnifies both outcomes. That’s why responsible risk management should guide every position.
FAQs About Volume Profile Trading Strategy
1) What is a volume profile trading strategy?
A volume profile trading strategy uses the amount of trading activity at different price levels to identify areas where the market has seen strong or weak participation.
2) What is the Point of Control in Volume Profile?
The Point of Control (PoC) is the price level where the highest volume was traded within the selected range. Traders often watch it as a potential support, resistance, or price magnet.
3) What do High Volume Nodes and Low Volume Nodes indicate?
High Volume Nodes show areas with significant trading activity, while Low Volume Nodes represent areas where relatively little volume was traded. Price can often move more quickly through low-volume areas.
4) How is Volume Profile different from a normal volume indicator?
A normal volume indicator shows how much trading activity occurred during a specific time period. Volume Profile shows where that activity occurred across different price levels.
5) Can Volume Profile predict the direction of crypto prices?
Not by itself. Volume Profile highlights important market structure and participation zones, but traders should use price action and other indicators to confirm a potential setup.
6) Is Volume Profile useful for crypto futures trading?
Yes. Traders can use it to identify potential support, resistance, breakout and value areas when planning crypto futures trades. Risk management is still essential, particularly when leverage is involved.

Sarvesh Pandey is a growth marketing professional at pi42, where he leads digital acquisition, partnerships, and user growth initiatives in India’s evolving crypto ecosystem. With experience across fintech, EdTech, and consumer internet brands, he shares insights on crypto adoption, trading trends, and performance-led growth strategies.
- Big Loot September: Trade & Win a BMW Bike 🏍️
 Big Loot September is Pi42’s biggest reward drop of the… Read more: Big Loot September: Trade & Win a BMW Bike 🏍️
 - Pi42 Week of Wins: Trade & Win a New iPhone This September
 Pi42 Week of Wins is a September contest where every… Read more: Pi42 Week of Wins: Trade & Win a New iPhone This September
 - Chandi Utsav: Refer and Win Silver Coin
 This September, turn your referrals into something worth its weight!… Read more: Chandi Utsav: Refer and Win Silver Coin
 - Booked by Pi42: Amsterdam Awaits — Trade More, Travel More ✈️
 Booked by Pi42 is a trading contest that could send… Read more: Booked by Pi42: Amsterdam Awaits — Trade More, Travel More ✈️
 - Pi42 Bandhan Bonus: Win Amazon Gift Vouchers This Rakhi
 Pi42 Bandhan Bonus is a Rakhi referral contest where you… Read more: Pi42 Bandhan Bonus: Win Amazon Gift Vouchers This Rakhi