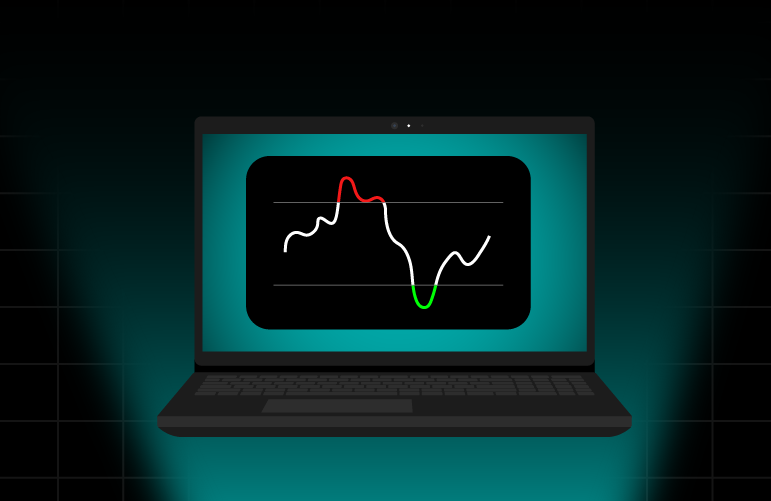
The Relative Strength Index (RSI) is a momentum oscillator that measures the speed and magnitude of price movements. Developed by J. Welles Wilder, this technical analysis tool helps traders identify whether a crypto asset is overbought or oversold, making it a valuable tool for decision-making.

The RSI ranges from 0 to 100 and is typically set to a 14-period timeframe. When the RSI value is above 70, the asset is considered overbought, indicating a potential price correction. Conversely, when the RSI is below 30, the asset is considered oversold, signalling a possible buying opportunity.
Understanding these RSI levels helps traders make more informed decisions by highlighting potential market reversals. In the next section, we’ll dive into how RSI is calculated and applied in real-world crypto trading scenarios.
How Does RSI Work in Crypto Trading?
The RSI is calculated using the following formula:
RSI=100−(1001+RS)RSI = 100 – \left( \frac{100}{1 + RS} \right)
where RS (Relative Strength) is the ratio of average gains to average losses over a defined period (usually 14 days). The RSI provides insights into market momentum and can help traders make more informed decisions.
Crypto traders use RSI to:
- Identify trend strength and reversals.
- Spot overbought and oversold conditions.
- Confirm entry and exit points in trades.
- Analyze bullish and bearish divergences.
How to Interpret RSI Values
- A high RSI (above 70) indicates strong bullish momentum.
- It may signal overbought conditions, but traders should confirm using other indicators before selling.
- RSI above 80 is sometimes considered extremely overbought, suggesting a stronger likelihood of price correction. However, such thresholds can vary depending on trading strategies and market conditions.
What Does a Low RSI Mean?
- A low RSI (below 30) What Does a High RSI Mean?
- suggests strong bearish momentum.
- It may indicate an oversold condition, but traders should look for confirmation before buying.
- RSI below 20 is considered extremely oversold, signalling a high probability of a price reversal.
What is an RSI Buy Signal?
- When RSI moves above 30 from oversold levels, it can be a buy signal.
- RSI divergence (when price moves lower but RSI moves higher) is another bullish reversal signal.
- Traders often combine RSI with support and resistance levels for more accurate entry points.

How to Use RSI for Crypto Trading
Combining RSI with Other Indicators
The RSI alone may not be sufficient to make trading decisions. Combining it with other indicators enhances accuracy:
- Moving Averages (MA) – RSI with 50-day or 200-day MA helps confirm trends.
- MACD (Moving Average Convergence Divergence) – A bullish MACD crossover with a rising RSI strengthens a buy signal.
- Bollinger Bands – Helps identify volatility alongside RSI levels.
- Volume Analysis – Higher volume near RSI reversal points increases reliability.
Avoiding False Signals from RSI
- RSI is most effective in range-bound markets, where prices fluctuate between support and resistance levels. In strong trending markets, RSI can remain overbought or oversold for extended periods, potentially leading to false signals.
- Look for RSI divergence to confirm trend reversals.
- Avoid trading solely based on RSI—always confirm signals with other indicators.
Customizing RSI Settings for Different Trading Styles
- Short-Term Traders: Use RSI 7-10 periods for faster, more responsive signals.
- Swing Traders: Default 14-period RSI is effective for mid-term trades.
- Long-Term Investors: Use RSI 21-30 periods for more stable signals and reduced noise.
Mistakes to Avoid While Using RSI Indicator
- Relying only on RSI for trade decisions – Always confirm with price action and volume.
- Ignoring overall market trends – RSI signals work best when aligned with the broader trend.
- Overtrading based on RSI alone – False signals can lead to unnecessary trades.
By being mindful of these common pitfalls, traders can avoid costly errors and use the RSI indicator more effectively in their crypto strategies.
Conclusion
The RSI indicator is a fundamental tool for crypto traders, helping identify overbought and oversold conditions while predicting potential trend reversals. However, RSI should be used in combination with other indicators for more reliable results.
Platforms like Pi42, India’s first Crypto-INhttps://pi42.com/blog/bollinger-bands-explained-what-they-are-and-how-to-use-them/https://pi42.com/blog/bollinger-bands-explained-what-they-are-and-how-to-use-them/R perpetual futures trading platform, provide traders with the perfect environment for executing RSI-based trading strategies while benefiting from no 1% TDS, no 30% flat tax, and up to 150x leverage. By mastering RSI interpretation and integrating it with other technical tools, traders can enhance their decision-making and improve their trading success in the volatile crypto market.
You Might Also Like
Understanding Long and Short Positions in Crypto Trading
How to Trade with Fibonacci Retracement in Crypto
Scalping in crypto futures

